
Microsoft Power BI การให้คำปรึกษา
Microsoft Power BI turns data from Dynamics 365 and your other systems into interactive reports and dashboards. We build the data model and the reports.
Dashboards • Data Models • Row-Level Security • Microsoft Fabric
Answer the Questions That Matter Most.
Each team reads its own measures from one shared data model.
ผลการดำเนินงานด้านการขาย
Revenue, opportunities and sales trends.
ผลการดำเนินงานทางการเงิน
Profitability, cash flow and budgets.
Inventory and Supply Chain
Stock levels and supplier performance.
พฤติกรรมลูกค้า
What customers buy and how often.
การส่งมอบโครงการ
Progress, resource use and budgets.
Procurement and Spend
Purchasing activity and supplier costs.
From Data to Decisions with Power BI.
Four steps take you from scattered data to useful reports.
Connect and Prepare
We combine data from every source and clean it.
Microsoft, cloud and third-party sources
Scheduled refresh keeps reports current
Build One Data Model
We link your tables once so every report uses the same logic.
Shared datasets for many reports
Calculations for your core measures
One set of figures for every team
Report and Explore
We build interactive reports and dashboards.
Main measures on one page
Drill-down from summary to detail
Web and mobile access
Share Securely
Each person sees only their own data.
Access follows your Microsoft sign-in
Row-level security by user or role
Workspaces that separate teams
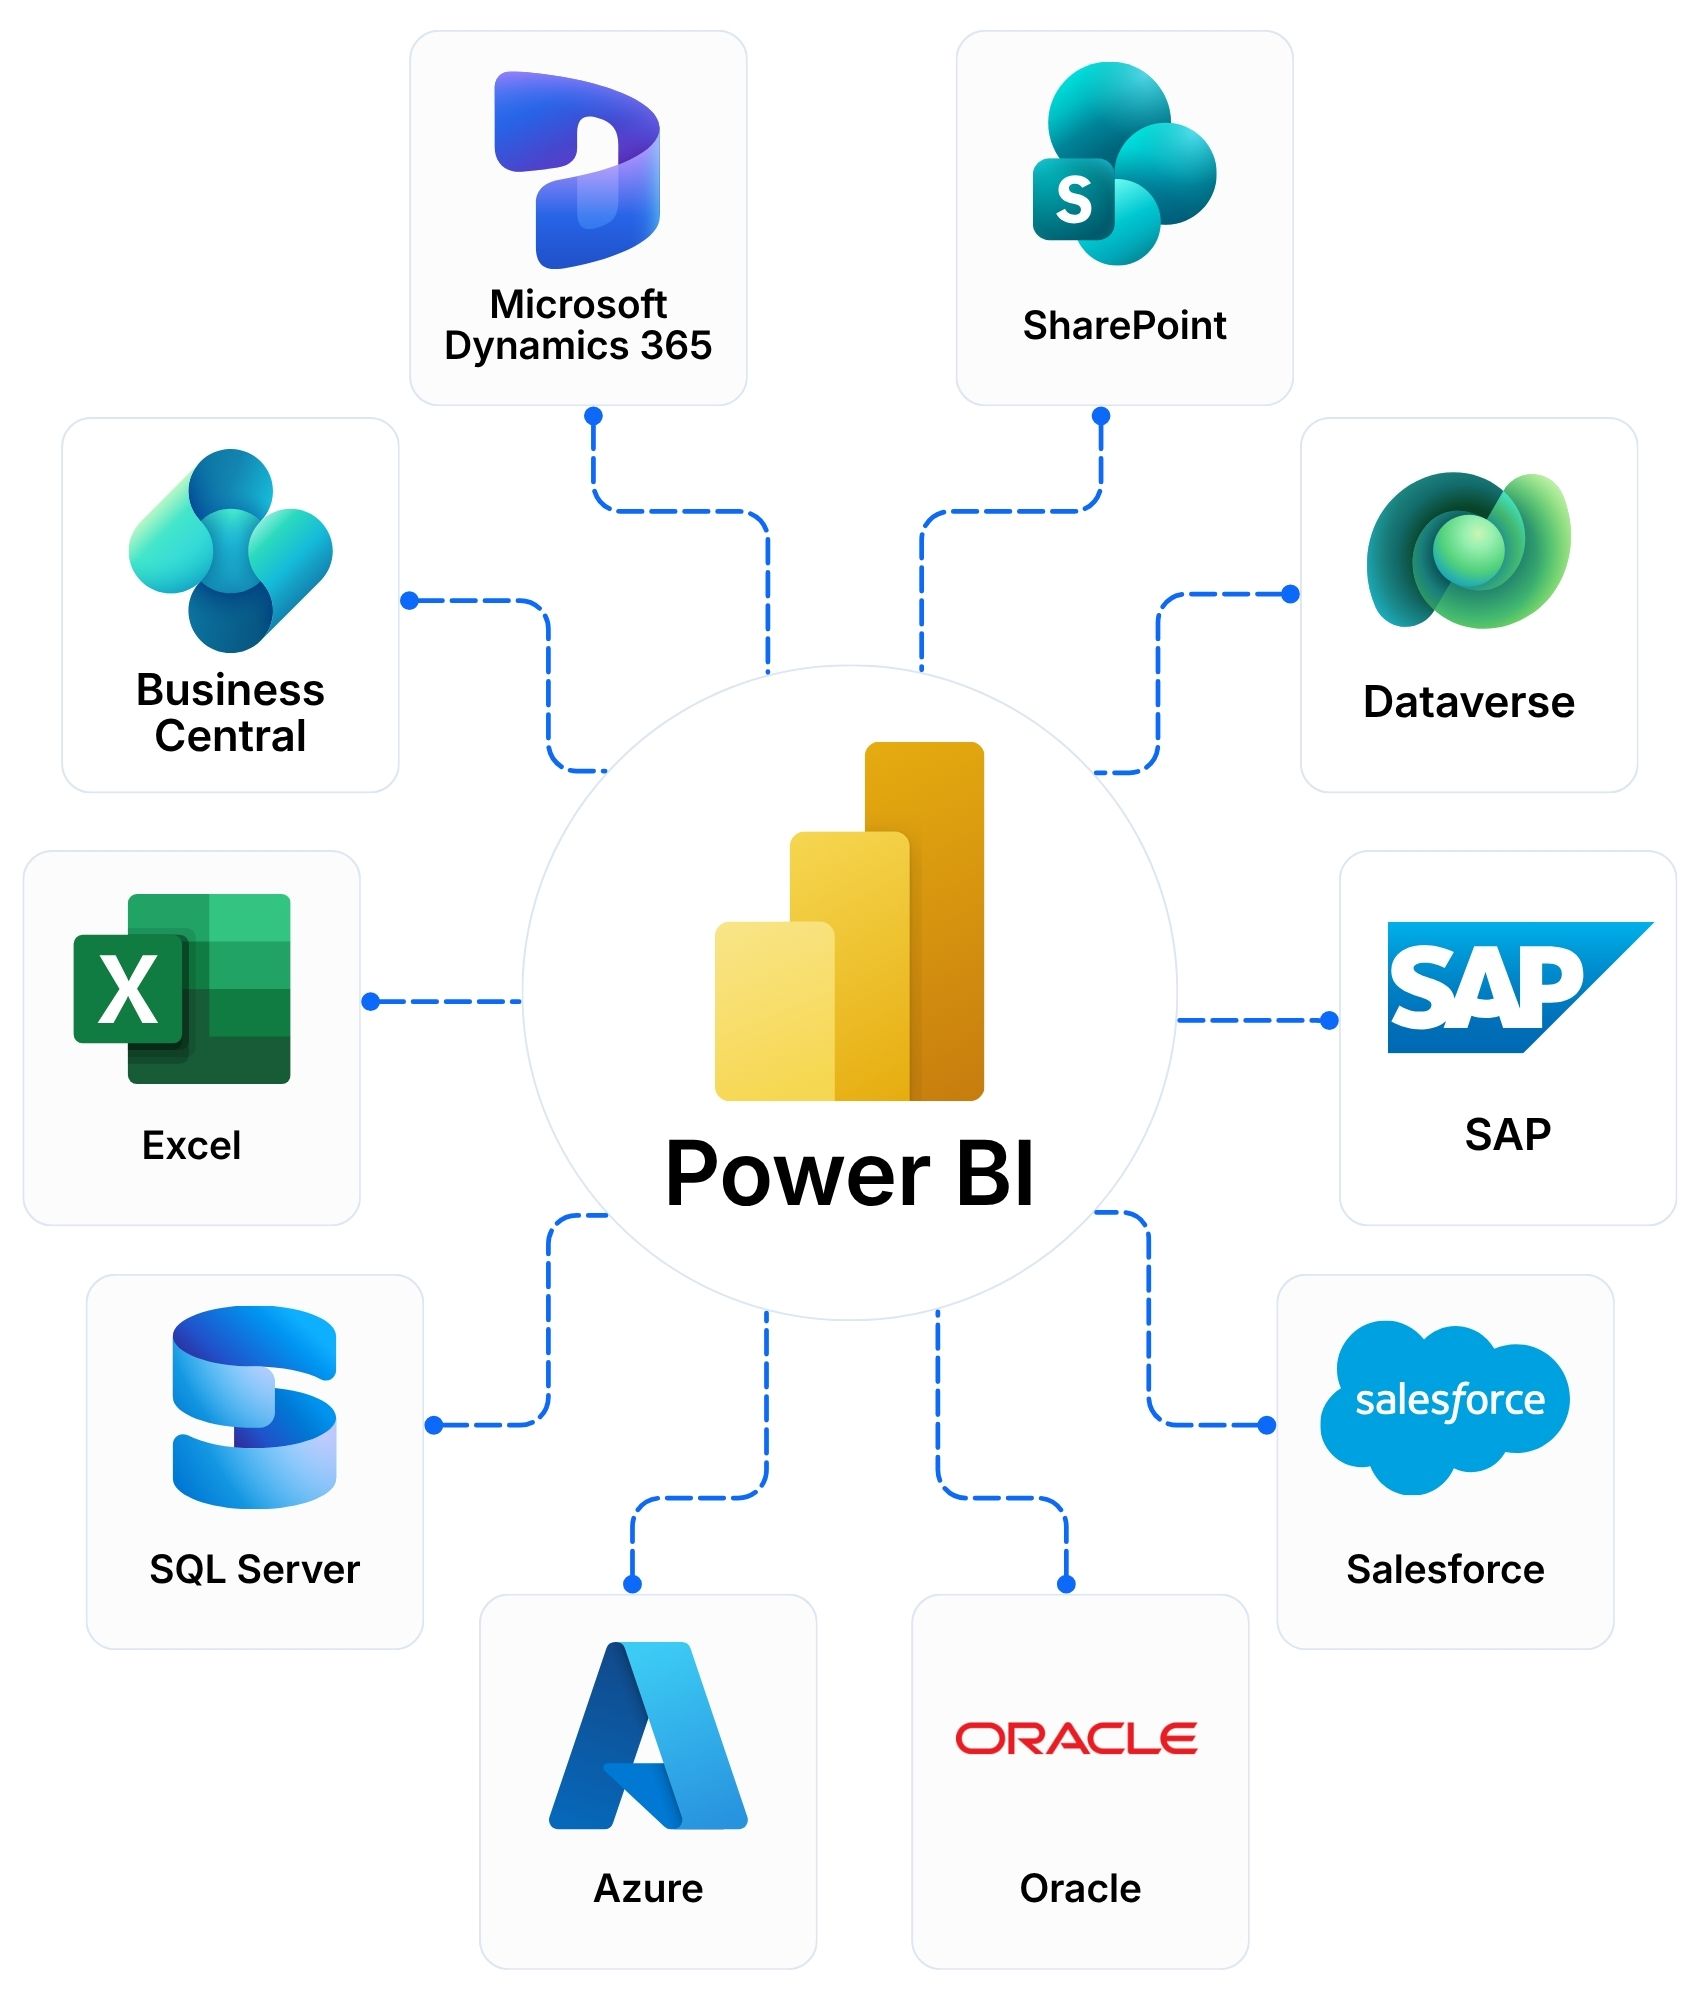
Connect Power BI with Your Business Systems.
Power BI reads from the systems you already use.
Reports shared in Teams and SharePoint
Analysis in Excel from your Power BI data
Alerts and flows with Power Automate
Reports on Business Central, Finance and Supply Chain Management, and CRM
Dataverse as a shared data source
SQL Server, Azure data services and data lakes
Capacity plans for large data volumes
Copilot answers questions about your data in plain language
Copilot helps build reports
PRIME agents built by 9 Dots
Questions About Microsoft Power BI.
What is Microsoft Power BI?
Microsoft Power BI is a business intelligence platform. Power BI connects your data sources and turns them into interactive reports and dashboards. 9 Dots Consulting builds the data model and the reports.
Can Power BI connect to Dynamics 365 and our other systems?
Yes. Power BI connects to Dynamics 365, Business Central, Excel, SharePoint, SQL Server, Azure and many third-party systems. 9 Dots Consulting designs the data model around the systems you already use.
How is Power BI different from Excel reporting?
Excel suits analysis by one person. Power BI combines data from many sources, refreshes reports on a schedule and lets many users share the same figures. The two work together, because Power BI can read your Excel files. 9 Dots Consulting helps you decide which reports to move first.
Is our data secure in Power BI?
Access follows your Microsoft sign-in. Row-level security limits data by user or role. 9 Dots Consulting designs the security around your organisation.
Can Copilot help us with Power BI?
Yes. Copilot answers questions about your data in plain language and helps build reports. Copilot needs Microsoft Fabric capacity and a licence. 9 Dots Consulting confirms what you need before you plan.
Do we need separate licences for Power BI?
The answer depends on the number of users and how you share reports. Power BI offers per-user licences and capacity plans through Microsoft Fabric. 9 Dots Consulting compares both for your user count and recommends one. We supply licences in ASEAN, Hong Kong, Taiwan and South Korea.
Do you support Power BI after go-live?
Yes. 9 Dots Consulting supports your Power BI reports after go-live through Application Management Services. We cover user support, updates, enhancements and monitoring.
Plan Your พาวเวอร์ บีไอ Project.
Tell us what to measure. We reply within one business day.